Why Engineers Love Excel
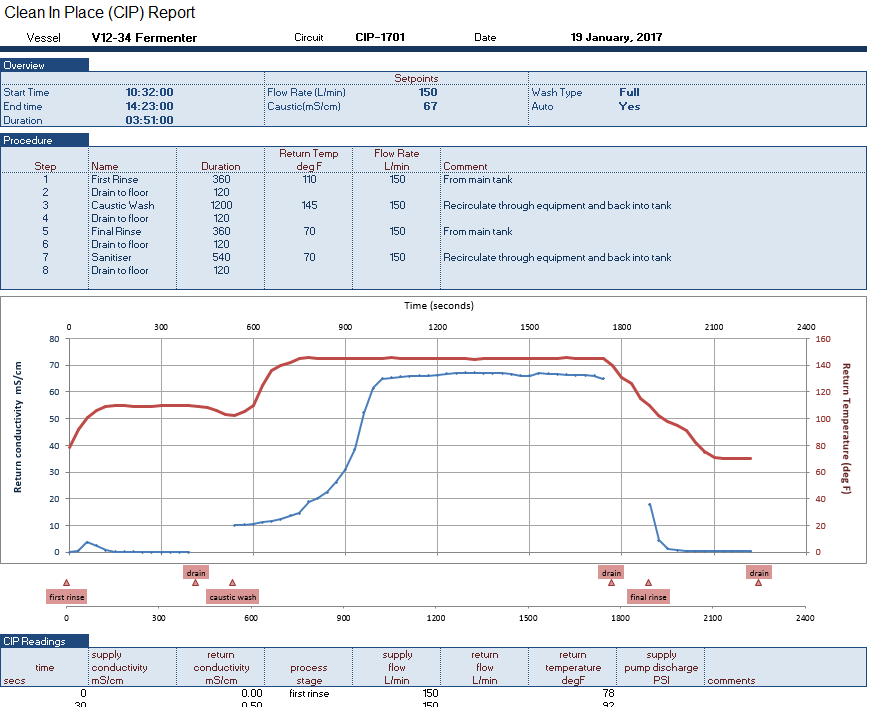
Excel is one of the most common tools used by engineers because a Workbook offers the necessary flexibility to solve virtually any problem they face using data tables, formulas, charts, and so on. A workbook is a blank canvas in which an engineer can represent any system of data and functions to process and visualize it as they see fit. The above report, for example, uses Excel features to compare the relationship of multiple KPI in a Clean-in-Place process and indicate the start and stop of various phases of that process. I doubt there is other analysis software that could create this display as easily as Excel.
However, in a SCADA setting, several challenges prevent Excel from shining through. For example, to produce the above report, a user would have to manually extract the data from a PLC, text file, or relational database. For many reports, the number of rows to summarize in the charts and formulas would change based on the duration of the process. There would also need to be a file naming convention indicating for the user which workbook to open to view the analysis of a particular cycle. That sounds like more work than most process engineers want to take up their time with.
Going Beyond Excel
XLReporter uses the features we all love about Excel, and welds on purpose-built industrial functionality! In the above animation, the report data collection is triggered by tags in the control system so that new data is collected at the start of the process cycle into a file named after the date and cycle ID. Collection continues while the cycle is processed, and charts, formulas and formatting are adjusted automatically to the dynamic number of rows. When the PLC indicates the cycle is complete, the report is sent to the supervisor as an email.
This is just one example of why workbooks ARE the best tool for automated reporting. To see more, check out the solutions page on our site, www.sytech.com